
Key Stats Every Casual NFL Fan Should Actually Understand

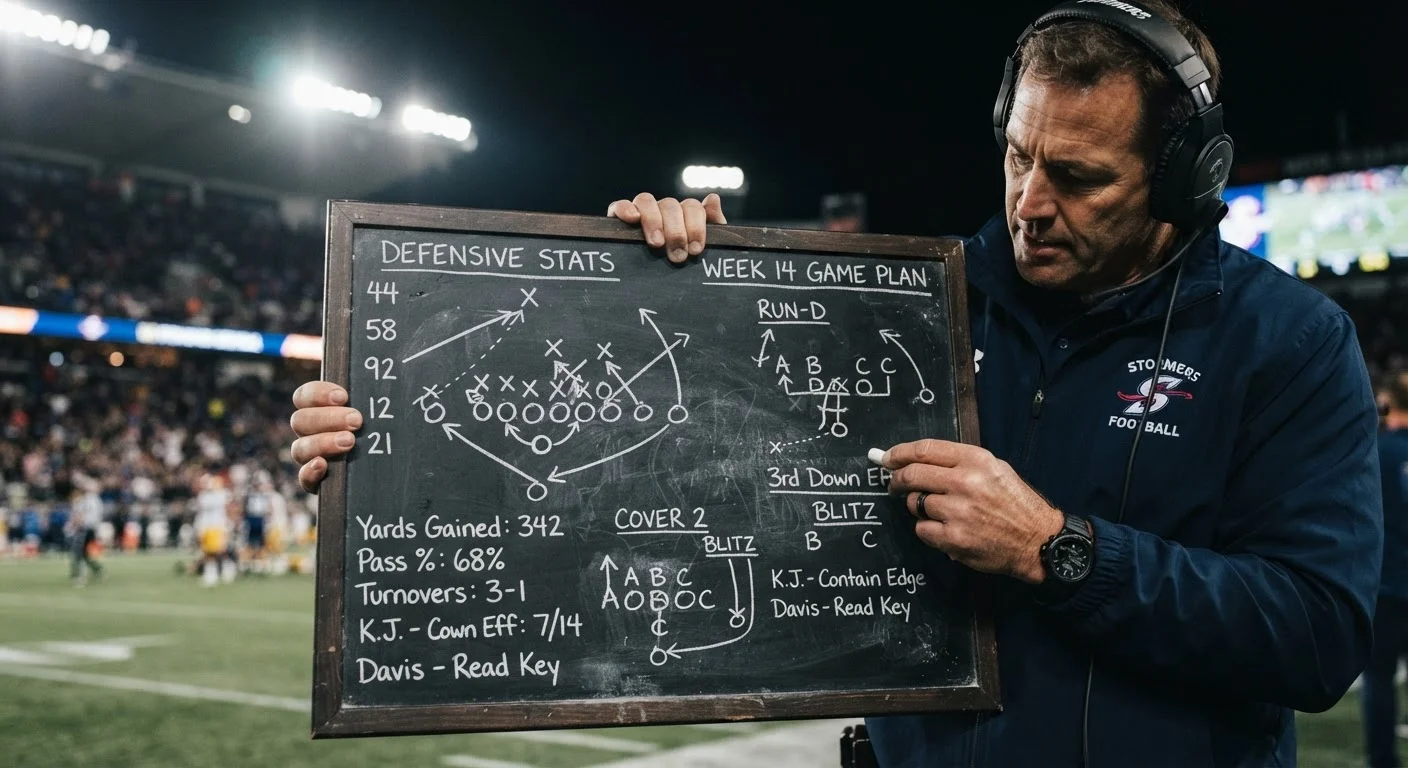
Photo: QuickAdvisor.net editorial
Why Traditional Stats Can Mislead You
Yards and touchdowns dominate the broadcast ticker, but they can create a misleading picture of how well a team or player is actually performing. A running back might rush for 100 yards on 30 carries - an inefficient outing - while another gains 80 yards on 15 attempts and breaks the game open. Raw totals without context are incomplete at best.
If you already follow how to read a football scoreboard, you have the foundation. The next step is understanding why certain numbers carry more analytical weight than others.
| Perfect passer rating | 158.3 (NFL official formula) |
| QBR scale | 0-100 (ESPN) |
| Average NFL completion percentage | Approximately 65% (League-wide trends, recent NFL seasons) |
| DVOA neutral benchmark | 0% (Football Outsiders methodology) |
| Yards per carry league average | Approximately 4.2-4.5 yards (NFL historical averages) |
| Plays measured by EPA | Every play from scrimmage (Pro Football Reference methodology) |
The most useful stats in football either account for volume (how many opportunities did a player get?) or opponent quality (how strong was the competition?). Keep both questions in mind as you explore the metrics below.
Quarterback Metrics: Passer Rating vs. QBR vs. EPA
Passer Rating is the stat you'll hear most often on TV. It factors in completion percentage, yards per attempt, touchdown percentage, and interception percentage into a single number. A rating above 100 signals an efficient outing; elite performances often exceed 120. Its limitation is that it ignores scrambles, sacks, and game-situation stakes.
QBR (Total Quarterback Rating) addresses several of those gaps. It credits quarterbacks for running plays, penalizes them for taking sacks, and weights plays by how much they mattered in the game's context - a fourth-quarter comeback drive counts for more than a garbage-time drive. QBR runs on a 0-100 scale, with 50 representing league average.
Expected Points Added (EPA) per play has become a favorite among analysts because it evaluates every play based on the scoring probability shift it created - not just the yards gained. A 4-yard gain on 3rd-and-3 carries far more positive EPA than a 4-yard gain on 1st-and-10.
No Single Stat Tells the Whole Story
Running Back and Receiver Stats Worth Knowing
For running backs, yards after contact separates power runners from those who depend heavily on good blocking. A back who consistently adds 3 or more yards after the first hit is demonstrating real individual ability. Yards before contact (the distance gained before any defender touches the carrier) tells you how well the offensive line is doing its job.
For wide receivers and tight ends, air yards and yards after catch (YAC) together explain where production comes from. A receiver who generates most of his output in YAC is being used on short routes and creating after the catch - a very different skill set from a receiver who regularly hauls in 20-yard completions. Target share - the percentage of a team's pass attempts directed at one player - indicates how central a receiver is to the offense, independent of whether those passes were completed.
Understanding how the NFL season is structured also helps here: stats in the first few weeks of the season can be small-sample noise, while second-half-of-season numbers tend to be more stable and meaningful.
Team-Level Stats: DVOA and What It Actually Shows
DVOA (Defense-adjusted Value Over Average) is one of the most respected team-level metrics in football analytics. Developed by Football Outsiders, it measures how efficiently a team performs on every play compared to a league-average team facing the same down, distance, and field-position situation - then adjusts for opponent strength.
A positive offensive DVOA means a team moves the ball more efficiently than average. A negative defensive DVOA means a team allows less than average - which is what you want from a defense. A team with strong DVOA in both phases is generally more reliable than one whose conventional record has been inflated by a soft schedule or turnover luck.
The key takeaway: DVOA rewards teams that consistently execute in high-leverage situations and penalizes empty production accumulated against weaker opponents. Casual fans who add this single metric to their toolkit will immediately have a sharper view of which teams are genuinely good versus which are winning on circumstance. Just as you'd look past flashy spec-sheet numbers to find what truly matters, the same discipline applies to reading an NFL box score.
The content on this site is for informational purposes only and is not a substitute for professional advice. Always consult a qualified professional for guidance specific to your situation.